Expertise:
Intermediate
Should we transform the index?
Like most economic indicators, the nondurable goods index tends to exhibit
exponential increase, corresponding to percentage increases over fixed time periods.
Moreover, the index tends to increase in size and volatility at the same
time, so that the large relative effects surrounding the Second World War seem
to be small relative to the large changes in the 1970s and 1980s, and seasonal
variation in recent years dwarfs that in early years.
We prefer, therefore, to study the logarithm of this index, displayed in Figure
2. The log index has an overall linear trend with a slope of 0.016, corresponding
to an annual rate of increase of 1.6%, and the sizes of the seasonal cycles are also
more comparable across time. We now see that the changes in the depression
and war periods are much more substantial and abrupt than those in recent
times. The growth rate is especially high from 1960 to 1975, when the baby
boom was in the years of peak consumption; but in subsequent years seems to
be substantially lower, perhaps because middle-aged "boomers" consume less,
or possibly because the nature of the index itself has changed.
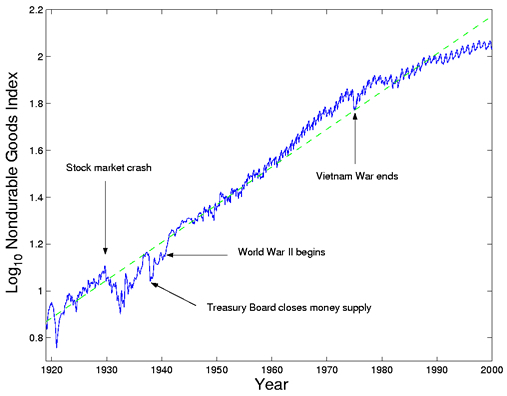
Figure 2: The monthly nondurable goods production shown in Figure 1 plotted
on a logarithmic scale.
The dotted straight line is estimated by least squares
regression, and has a slope of 0.016,
corresponding to a 1.6% increase in the index per year.
How will functional data analysis help?
There is a vast library of methods for analyzing long time series, and they
seemingly would be the first choice in this situation, too. However, notions like
ARIMA processes, frequency domain time series analysis and the Kalman filter
are based on the idea of stationarity, the idea that the internal structure of
the series remains unchanged over the span of observations. The goods index,
however, is clearly nonstationary in many ways. There are important departures
from linearity, and the seasonal trend, as we shall see, also changes dramatically
from one epoch to another. Moreover, the series is intrinsically rather smooth;
a huge economy like that of the U. S. A. does not change its behavior suddenly.
We can exploit that smoothness by looking at derivative information.
The data consist of 973 monthly values of the index covering the period from
January, 1919, to December, 2000, and can be obtained from the
FDA software site.
|