|
The Features of Human Growth Data | |
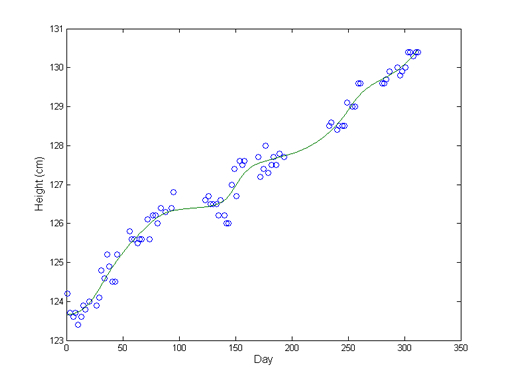
Expertise: Beginner Figure 2 zooms in on growth by using measurements of a boy's height at 83 days over one school year, with gaps corresponding to the school vacations. The measurement noise in the data, of standard deviation about 3 mm, is apparent. The trend is also noticeably more bumpy, with height increasing more rapidly over some weeks than others.
| |