|
The Features of Human Growth Data | |
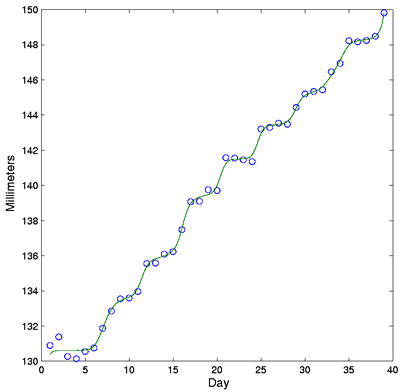
Expertise: Beginner To zoom in further, more accurate measurements are essential. The length of the tibia of a baby measured to within about 0.1 mm is graphed in Figure 3. The jumps, or saltations, that we saw in the boy's growth are now much more visible. These data demand that we find a way to estimate just how much bone length changes over, say, a 24-hour period. Since bone length can only increase, it is essential that any smooth line, such as that in the figure, also be everywhere increasing, and this is one of the features of the smoothing method we use.
In these growth examples, we look at some new developments in growth data analysis. A recently developed method for monotonic smoothing is applied to some old and new data. This method is used for all the curves estimated below, and is described in the example Monotone Smoothing of the Growth Data. Another aspect of the analysis is the introduction of curve registration methods, which allow the separation of amplitude and phase variation. | |